Pasta dataset
Ever been curious about the distribution of letters and other symbols in alphabet pasta?
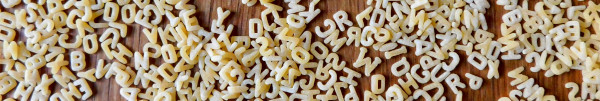
Here comes the pasta dataset: three different kinds of alphabet pasta, thousands of raw photos of pasta pieces on a blue background, and gray-scale images of more than 20000 single pieces of pasta extracted from the raw images.
The dataset is intended for training students on semi-supervised learning (clustering plus manual labeling of clusters) and other machine learning techniques with real-world data. An interesting task is to count all pieces of pasta and get relative frequencies of all letters.
Photos have been taken automatically by a LEGO machine (see below for details and video).
Download
ZIP file with PNG and JPG images (1.1 GiB): pasta.zip
The ZIP file contains six folders named raw_xyz and noodles_xyz, where xyz is one of albhof, gaggli, riesa (three different products).
License
Raw and processed images are licensed under the Creative Commons Attribution-ShareAlike 4.0 International License (summary). The dataset as a whole is licensed under the Open Data Commons Open Database License (ODbL) v1.0 (summary).
Size and contents
The dataset contains images of 750g alphabet pasta, 250g per type/product. Products are labeled albhof, gaggli, riesa.
‘albhof’ and ‘riesa’ images look very similar (letters A-Z), whereas ‘gaggli’ is different (A-Z, 0-9, some special symbols). Details on image formats and file name conventions are provided below.
The dataset contains more than 3300 raw cam images, which show more than 23000 pieces of pasta depicted in almost 22000 processed images.
Recording technique
A LEGO machine based on a LEGO Spike Prime set and corresponding expansion set takes some pieces of pasta from a storage container and places them under a usual webcam. The cam takes an image, which then gets analyzed for quality.
If the image is okay, that is, if at least half the pasta pixels belong to isolated pieces of pasta (not too many conglomerations), pieces get removed from the machine. If the image is not okay, all pasta pieces are put into a separate container and the image is dropped. Dropped paste pieces are put back into the storage container from time to time. Thus, each piece of pasta finally will be shown on some image of sufficient quality.
Here is a video showing the machine in action:
I do not publish the algorithm for analyzing the images here, because thinking about the problem and developing an algorithm is a regular task for my students. If you are interested in the details, please contact me via email.
Raw camera images
The dataset contains raw (that is, unprocessed) images from the webcam (1280x720 JPG file). Files are named cam_TIMESTAMP_noodle.jpg, where TIMESTAMP is the recording time (Unix time in nanoseconds).
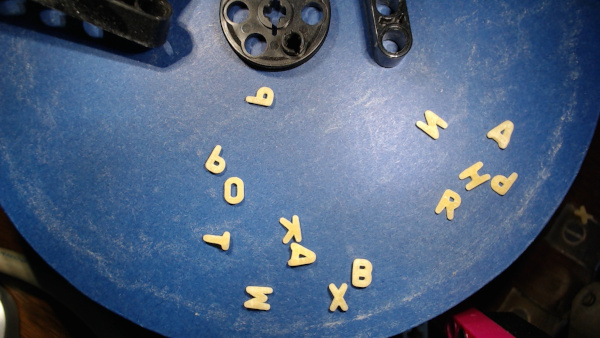
Each 200 or fewer images there is an image without any pasta pieces, named cam_TIMESTAMP_empty.jpg. Those images may be used for color calibration, correcting small alterations of cam position and lighting, and so on.
The blue background got dirtier and dirtier during the recordings, which took about 20 hours in total. From time to time I cleaned it with mediocre success. Pasta-less images document the plate’s condition.
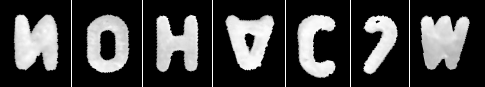
Images of single pasta pieces
Next to raw images the datasets contains images showing only one single piece of pasta. The extraction process uses simple image processing techniques (no machine learning stuff). I do not publish the details here (else my students would sneak peaks at this webpage). If you’re interested, please contact me via email.
The images are stored as gray-scale PNG files of different size (as small as possible). Color range of each image is scale to the maximum, that is, there’s always a black and a white pixel. File names have the form SUBSET_TIMESTAMP_INDEX.png. Here, TIMESTAMP is the time stamp of the raw cam image from which the pasta piece has been extracted. INDEX is a consecutive number denoting the different pieces of pasta in the cam image. SUBSET is one of cut, noodle, glued and describes the quality of the image.
Files with ‘cut’ contain images of pasta pieces lying at the cam image’s border. Such pieces haven’t been recorded fully.

Files with ’noodle’ are the good ones: one piece of pasta per file. Images have been rotated to have all images showing the same letter in identical orientation. That’s not necessarily the correct orientation. But it’s a consitent one (up to some exceptions, where there are two different orientations for a letter).

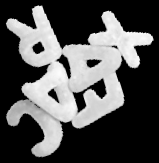
Files with ‘glued’ show more than one piece of pasta. Whether a file is labeled ’noodle’ or ‘glued’ solely depends on the height of the image. Thus there might be misslabelings, especially for the ‘gaggli’ type of pasta, which contains very differently sized pieces of pasta.
Log files
Each folder with processed images contains a log file created during processing. For each raw cam image there are two lines (except for the empty calibration images, which only have the file name line) showing the raw image’s file name (line 1) and information on image quality (line 2). Image quality is described by two numbers, labeled ‘okay’ and ‘dropped’. The ‘okay’ value is the number of pasta pixels belonging the an isolated piece of pasta (resulting in a noodle_....png file). The ‘dropped’ value is the number of pasta pixels belonging to pieces of pasta shown in cut....png and glued....png files.
The last two lines of each log file show the total number of good and dropped pasta pixels. From those values and the number of noodle....png files one can estimate the total number of pasta pieces in the dataset.